Launching Custom Location Scoring for Deal Sourcing

Supercharge Your Deal Screening with Unmatched Precision
Are you tired of sifting through countless deals that don't align with your investment strategy?
Last month, we launched Archer Deal Sourcing 2.0 - and now are introducing Custom Location Scoring, a powerful new feature that empowers you to identify the most promising opportunities with unparalleled precision.
Tailor Your Screening, Your Way
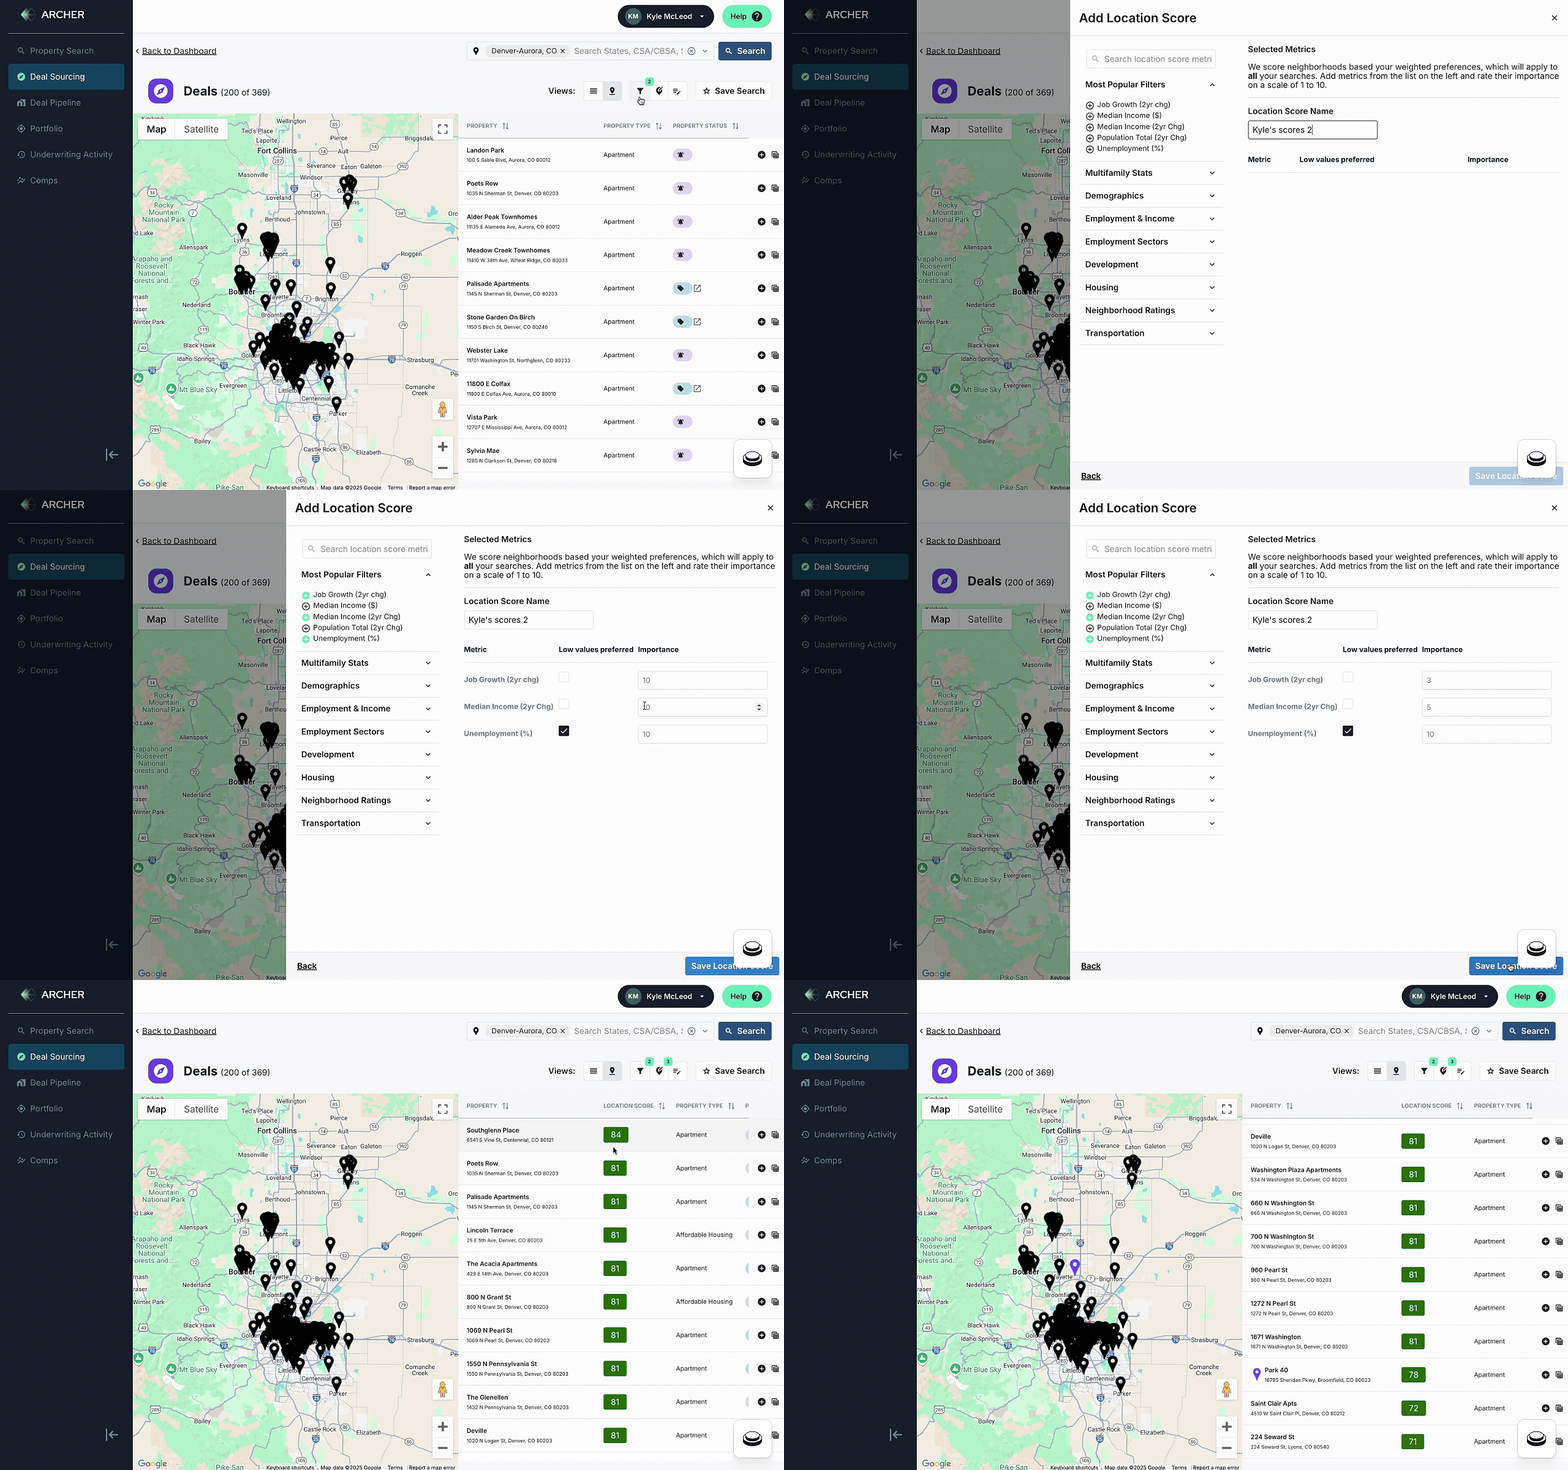
With Custom Location Scoring, you can now create personalized scoring models that reflect your unique investment criteria. Assign weights to over 100 location metrics on top of the 140 strategy filters, including:
- Demographic Trends: Population growth, age demographics, and household income
- Economic Indicators: Job growth, unemployment rates, and industry diversification
- Real Estate Fundamentals: Rent growth, vacancy rates, and capitalization rates
- Neighborhood Amenities: Schools, parks, transportation, and walkability scores
- Forecasted Metrics: Future rent growth, vacancy rates, and property values
By customizing your scoring model, you can identify properties that meet your specific requirements and prioritize deals that align with your investment goals.

How it Works
- Define Your Criteria: Select the metrics that are most important to you and assign weights to each.
- Generate Personalized Scores: Our platform automatically calculates scores for each property based on your customized criteria.
- Prioritize Your Pipeline: Focus on the highest-scoring properties and accelerate your deal flow.

Here's an example of a custom deal strategy and location scoring criteria that we created:
For a deal strategy filter set:
- Location: Dallas-Fort Worth, TX-OK (this is the Dallas CSA)
- Property Type = Apartment
- Property Status = On Market, Seller Prop: High or Seller Prop: Medium
- Property Class = A or B
- Rent Growth vs Comps (2yr) = max of 0 (which means the rent growth for a property hasn't kept up with the comps around it)
- Ratio: Current Rent versus Comps = max of 90 (which means the property's current rents are at about 90% of the median comp)
- Value Add Rent upside ($/unit) = min of 150 (which means comparing the property to more recently renovated properties around it, there appears to be at least $150/unit average upside if you renovate the property)

I saved this search as "Dallas >50unit Lagging Comps w/ Value Add upside"
I then created a Location Score called "Strong Demand, but Lagging Rents" (this is shared by everyone on my team) that we can use to highlight areas with:

- Strong Income Growth
- Low Unemployment
- Highly educated population
- Population growth among renter aged demographic
- Overall high livability index
- Access to Parks = potentially desirable area
- But where Class A rents haven't increased dramatically yet; and
- Forecasted completions are low

We designed Custom Location Scoring to empower you with deeper insights and help you streamline deal sourcing on your terms. By tailoring each property’s score to reflect your specific goals, you’ll discover high-potential opportunities faster and feel more confident in every move you make.
We look forward to seeing how you use this powerful new feature, and as always, we welcome your feedback on how it can further enhance your workflow.